Category Archives: digital marketing

Real Tech Worker Pay Revisited (2013 Data)

Last year TOTSB looked at tech worker pay in “How Crain’s Chicago Got Tech Worker Pay Wrong.” That post was response to a misleading story that Crain’s Chicago business published that bemoaned how Chicago tech workers’ pay was not as high as other US cities, claiming “Tech talent is in high demand in Chicago these days, and pay is going up. Unfortunately it still lags what techies make in many other big cities…”  DICE salary data was referenced which lent credence to the argument being made.

The problem with this narrative it is wrong-minded and very misleading. So far, no retraction from the author or publisher. The fact is that when compared to NYC and Silicon Valley pay and when just looking at the DICE raw numbers, it appears that workers are better off in those markets because the pay is higher.

Although this is true in Nominal Dollars, reality is different as each area has different costs of living for the same goods and services, e.g. housing, groceries, utilities and so on. Often used for analysis of inflation over time, this kind of method is referred to as Real and Nominal Value.

Click to Expand

Click to Expand

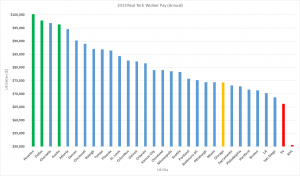
With that in mind, the data was updated with 2013 salaries expanding the number of cities reviewed from 10 to 31 US Cities. Of course, it tells a very different story from what Crain’s Chicago Business had suggested last year.

Some interesting highlights of the data:

  • Texas cities Houston, Dallas and Austin are some of the best deals for workers with Charlotte, NC and Atlanta also looking good (left-most on graph)
  • NYC and Silicon Valley are absolutely the worse deal for workers (right most on graph)
  • Chicago (my current home base) looks good better than the usual suspects, but it is well below mean and median, i.e. in comparison to many other US cities, which may have something to do with Illinois, Cook County and Chicago financial shenanigans.
  • Mean and Median were close at $80,345 and $79,050 respectively
  • Quality of living arguments can be inserted at this point (cold winters) as well as the impact of high-taxes on local economy
Rank Market Area Local Avg Index Real Dollars Comments
1 Houston $92,475 92.2 $               100,298
2 Dallas $89,952 91.9 $                 97,880
3 Charlotte $90,352 93.2 $                 96,944
4 Austin $91,994 95.5 $                 96,329
5 Atlanta $90,474 95.6 $                 94,638
6 Denver $93,195 103.2 $                 90,305
7 Cincinnati $83,537 93.8 $                 89,059
8 Raleigh $85,559 98.2 $                 87,127
9 Tampa $80,273 92.4 $                 86,876
10 Phoenix $87,114 100.7 $                 86,508
11 St. Louis $76,220 90.4 $                 84,314
12 Columbus $76,035 92.0 $                 82,647
13 Detroit $81,832 99.4 $                 82,326
14 Orlando $79,805 97.8 $                 81,600
15 Kansas City $77,329 97.8 $                 79,069
16 Cleveland $79,840 101.0 $                 79,050
17 Minneapolis $87,227 111.0 $                 78,583
18 Seattle $95,048 121.4 $                 78,293
19 Portland $84,295 111.3 $                 75,737
20 Baltimore + DC $97,588 129.8 $                 75,212 avg
21 Pittsburgh $68,100 91.5 $                 74,426
22 Miami $78,872 106.0 $                 74,408
23 Chicago $86,574 116.5 $                 74,312
24 Sacramento $85,100 116.2 $                 73,236
25 Philadelphia $92,138 126.5 $                 72,836
26 Hartford $87,265 121.8 $                 71,646
27 Boston $94,531 132.5 $                 71,344
28 LA $95,815 136.4 $                 70,246
29 San Diego $90,849 132.3 $                 68,669
30 SV $108,603 164.0 $                 66,221
31 NYC $93,915 185.8 $                 50,546 3 borough avg
Mean $87,158 $111 $80,345
Median $87,227 $101 $79,050
Mode #N/A 97.8 #N/A
Max $108,603 $186 $100,298
Min $68,100 $90 $50,546
Std Dev $8,052 $22 $10,837

SOURCES: DICE US Salary Survey 2013 and US City Cost of Living (Infoplease).
The Encima Group Donates Tag Management Referrals, Maintains Neutrality

The latest from Encima but a long-time in the making….hopefully more digital analysts and marketers will consider Piwik as an open source alternative to sharing their precious customer data with G. And of course, the DAA is doing some great things for the industry and we want to be a part of that. Special thanks to David Clunes for his vision and support on this initiative.

Encima Group LogoNewark, DE – August 18, 2014 – Analytics consultancy The Encima Group, is pleased to announce the donation of several thousand dollars in referral fees earned through the recent recommendation and subsequent implementation of Signal’s technology platform. Signal’s Tag Management system (formerly BrightTag) was chosen by two of Encima’s major pharmaceutical clients as the best-in-class tag management solution. For one Encima client, their prior tag management system took too much time to use and was expensive. It was replaced with Signal and the client is already seeing ongoing tag maintenance now taking less than 10% of the time that it did before. For another client, Signal was deployed together with an enterprise site analytics solution across several high-profile Web sites making ongoing tag maintenance a snap.

David Clunes, CEO and Founder of The Encima Group explains, “With technology vendors often jockeying on new capabilities, we prefer let them do what they do best without getting caught up. We purposefully do not recommend the technology platforms that make us the most money, instead we recommend what is best for our client’s long-term analytics success. Donations like this help us continue to maintain our neutrality – all while doing some good for the industry.”

The Encima Group, known best for its independent analytics and digital operations services often finds itself recommending platforms for clients. Sometimes viewed as another value-added reseller, The Encima Group sees itself as an extension of their clients’ organizations and vigorously maintains its “Switzerland” status. That sensibility extends from the firm’s analytics practice which uniquely eschews agency media buying and creative services to focus on providing clients with both objective performance reporting and unbiased campaign optimization recommendation.

Clunes continues, “When it comes to analytics, more objectivity is always a good thing. We feel that this is a great way of paying it forward and that hopefully other firms get the idea.” By sharing the referral fees that it earned, Encima is simultaneously investing in two worthy causes known to analytics professionals worldwide: The Digital Analytics Association, a global organization for digital analytics professionals and Piwik, the globally popular open source Web analytics platform.

“The Digital Analytics Association is thrilled by the Encima Group’s donation,” said DAA Board Chair, Jim Sterne. “The funds will be added to our general fund to benefit all members of the DAA. We hope that others in the space will follow Encima’s leadership in this area.” For Piwik, the funds will be used to facilitate continued development of this open-source platform. Available as an alternative to sharing with 3rd parties, Piwik allows digital marketers to control their Web site behavioral data. Maciej Zawadziński, of the Piwik Core Development Team says, “This is great and will help us to further develop an alternative free Web analytics platform.”

About The Encima Group

The Encima Group is an independent analytics consultancy that was recently recognized for its successful growth in the Inc. 5000 (ranking in top 25%). The Encima Group’s mission really is about actionable analytics and flawless execution. Offering an integrated suite of services around multi-channel measurement, tag management, dashboards, technology strategy consulting and marketing operational support, The Encima Group pioneered the notion of Data Stewardship. The Encima Group is based in Newark, DE with offices in Princeton, NJ and Chicago, IL. Its client roster includes leading pharmaceutical companies like Bristol-Myers Squibb, Shire Pharmaceuticals, Otsuka, AstraZeneca and Novo Nordisk.

For more information about The Encima Group, visit www.encimagroup.com. For more information about Signal visit www.signal.co, for Piwki visit www.piwik.org and for the Digital Analytics Association visit www.digitalanalyticsassociation.com.

Media Contact(s)

Jason Mo, Director of Business Development (jmo AT encimagroup DOT com); phone (919) 308-5309; Domenico Tassone, VP Digital Capabilities (dtassone AT encimagroup DOT com); Phone.


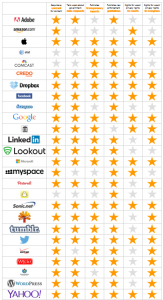
EFF Updates “Who Has Your Back” on Gov’t Data Requests

A very individual citizen-focused look at who cares about user data when the Feds come knocking. The six-dimension scale includes: warrants, data requests, transparency reporting, has guidelines for law enforcement, frights for user privacy in US Courts and in US Congress.


EFF

Full EFF Report…

The scoring would be very different if this was entitled, “Who has advertiser’s back?” with regard to businesses user data.

Piwik: Alternative Analytics Presentation in Chicago

Yours truly will be presenting, “Piwik: An Analytics Alternative,” a short presentation at this year’s Open Analytics Summit at the City Winery in Chicago on March 27th.

OAS is for Developers, Engineers, Data Scientists, CMOs, Data Analysts, CTOs, Architects, Brand Managers, and anyone passionate about open source technologies, big data, or data analytics. My presentation will be particularly interesting to digital marketers, enterprise technologists, Web analytics practitioners and others that are interested in a viable way to provide solid measurement while removing Google from their Web analytics stack.

Full Schedule and Register

If there is interest, I’ll post the presentation here as well.

Mass Surveillance?


Digital Channel Attribution…A Cheat Sheet

Last click, last touch, first touch, fractional…Adometry, TagMan, Visual IQ, Convertro, Omniture, C3 and ClearSaleing…there is no shortage of techniques and vendors claiming to have the right solution for digital marketers today.

Forrester recently released their The Forrester Wave™: Cross-Channel Attribution Providers, Q2 2012 and got most of it right. However, as a recent and current practitioner of digital attribution analysis they curiously weighted market share over real-time data collection – strange!

In any case, if you are still struggling to understand the the various attribution methods used in digital marketing channel analysis and want to avoid the painful learning curve, take a look at the simple vendor-neutral hype-free cheat sheet.

What do you think? Send your feedback!
Download Digital Attribution Cheat Sheet r3.1