The problem with this narrative it is wrong-minded and very misleading. So far, no retraction from the author or publisher. The fact is that when compared to NYC and Silicon Valley pay and when just looking at the DICE raw numbers, it appears that workers are better off in those markets because the pay is higher.
Although this is true in Nominal Dollars, reality is different as each area has different costs of living for the same goods and services, e.g. housing, groceries, utilities and so on. Often used for analysis of inflation over time, this kind of method is referred to as Real and Nominal Value.
Click to Expand
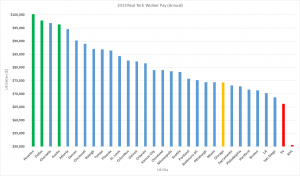
With that in mind, the data was updated with 2013 salaries expanding the number of cities reviewed from 10 to 31 US Cities. Of course, it tells a very different story from what Crain’s Chicago Business had suggested last year.
Some interesting highlights of the data:
- Texas cities Houston, Dallas and Austin are some of the best deals for workers with Charlotte, NC and Atlanta also looking good (left-most on graph)
- NYC and Silicon Valley are absolutely the worse deal for workers (right most on graph)
- Chicago (my current home base) looks good better than the usual suspects, but it is well below mean and median, i.e. in comparison to many other US cities, which may have something to do with Illinois, Cook County and Chicago financial shenanigans.
- Mean and Median were close at $80,345 and $79,050 respectively
- Quality of living arguments can be inserted at this point (cold winters) as well as the impact of high-taxes on local economy
| Rank | Market Area | Local Avg | Index | Real Dollars | Comments |
| 1 | Houston | $92,475 | 92.2 | $ 100,298 | |
| 2 | Dallas | $89,952 | 91.9 | $ 97,880 | |
| 3 | Charlotte | $90,352 | 93.2 | $ 96,944 | |
| 4 | Austin | $91,994 | 95.5 | $ 96,329 | |
| 5 | Atlanta | $90,474 | 95.6 | $ 94,638 | |
| 6 | Denver | $93,195 | 103.2 | $ 90,305 | |
| 7 | Cincinnati | $83,537 | 93.8 | $ 89,059 | |
| 8 | Raleigh | $85,559 | 98.2 | $ 87,127 | |
| 9 | Tampa | $80,273 | 92.4 | $ 86,876 | |
| 10 | Phoenix | $87,114 | 100.7 | $ 86,508 | |
| 11 | St. Louis | $76,220 | 90.4 | $ 84,314 | |
| 12 | Columbus | $76,035 | 92.0 | $ 82,647 | |
| 13 | Detroit | $81,832 | 99.4 | $ 82,326 | |
| 14 | Orlando | $79,805 | 97.8 | $ 81,600 | |
| 15 | Kansas City | $77,329 | 97.8 | $ 79,069 | |
| 16 | Cleveland | $79,840 | 101.0 | $ 79,050 | |
| 17 | Minneapolis | $87,227 | 111.0 | $ 78,583 | |
| 18 | Seattle | $95,048 | 121.4 | $ 78,293 | |
| 19 | Portland | $84,295 | 111.3 | $ 75,737 | |
| 20 | Baltimore + DC | $97,588 | 129.8 | $ 75,212 | avg |
| 21 | Pittsburgh | $68,100 | 91.5 | $ 74,426 | |
| 22 | Miami | $78,872 | 106.0 | $ 74,408 | |
| 23 | Chicago | $86,574 | 116.5 | $ 74,312 | |
| 24 | Sacramento | $85,100 | 116.2 | $ 73,236 | |
| 25 | Philadelphia | $92,138 | 126.5 | $ 72,836 | |
| 26 | Hartford | $87,265 | 121.8 | $ 71,646 | |
| 27 | Boston | $94,531 | 132.5 | $ 71,344 | |
| 28 | LA | $95,815 | 136.4 | $ 70,246 | |
| 29 | San Diego | $90,849 | 132.3 | $ 68,669 | |
| 30 | SV | $108,603 | 164.0 | $ 66,221 | |
| 31 | NYC | $93,915 | 185.8 | $ 50,546 | 3 borough avg |
| Mean | $87,158 | $111 | $80,345 | ||
| Median | $87,227 | $101 | $79,050 | ||
| Mode | #N/A | 97.8 | #N/A | ||
| Max | $108,603 | $186 | $100,298 | ||
| Min | $68,100 | $90 | $50,546 | ||
| Std Dev | $8,052 | $22 | $10,837 |
SOURCES: DICE US Salary Survey 2013 and US City Cost of Living (Infoplease).
